
Most Meta ad testing stops at the metrics Meta reports. Impressions. CPM. Cost per result, if a custom conversion event is configured. Whichever ad set wins on those numbers gets scaled.
We test differently. Every ad set comparison we run gets measured against attributed Spotify streams, not just the on platform conversion event, because the two don’t always move together.
Here’s a recent test that shows exactly why that distinction matters, and what we found when we ran the comparison all the way through.
TL;DR
No single variant won the whole funnel. One variant produced the cheapest reach and the most landing page clicks. A different variant produced the best stream-to-auth rate. Neither was the overall winner on cost per stream.
The winning variant was deliberately built by combining the mechanism that drove top-of-funnel efficiency in one setup with the mechanism that drove bottom-of-funnel quality in another. The result: 15% lower cost per stream than our production control, with more attributed streams and a lower cost per auth.
How We Ran the Test
Five ad set variants ran head to head on the same track, same creatives, same daily budget (~$20/day), same time window. Each variant changed exactly one variable from the previous step, creating a controlled progressive isolation structure.
| Variant | What changed from previous |
|---|---|
| Control | Current production default (no changes) |
| Variant 1 | Modified audience age range |
| Variant 2 | Added genre interest layer, restricted to one placement |
| Variant 3 | Removed one audience restriction from Control |
| Variant 4 | Combined the top-of-funnel mechanism from Variant 3 with the quality mechanism from Control |
Variants Control through 3 ran June 11–15. Variant 4 ran June 16–20. Each had five full days of data at comparable spend, including their respective Day 1 learning period.
The Results
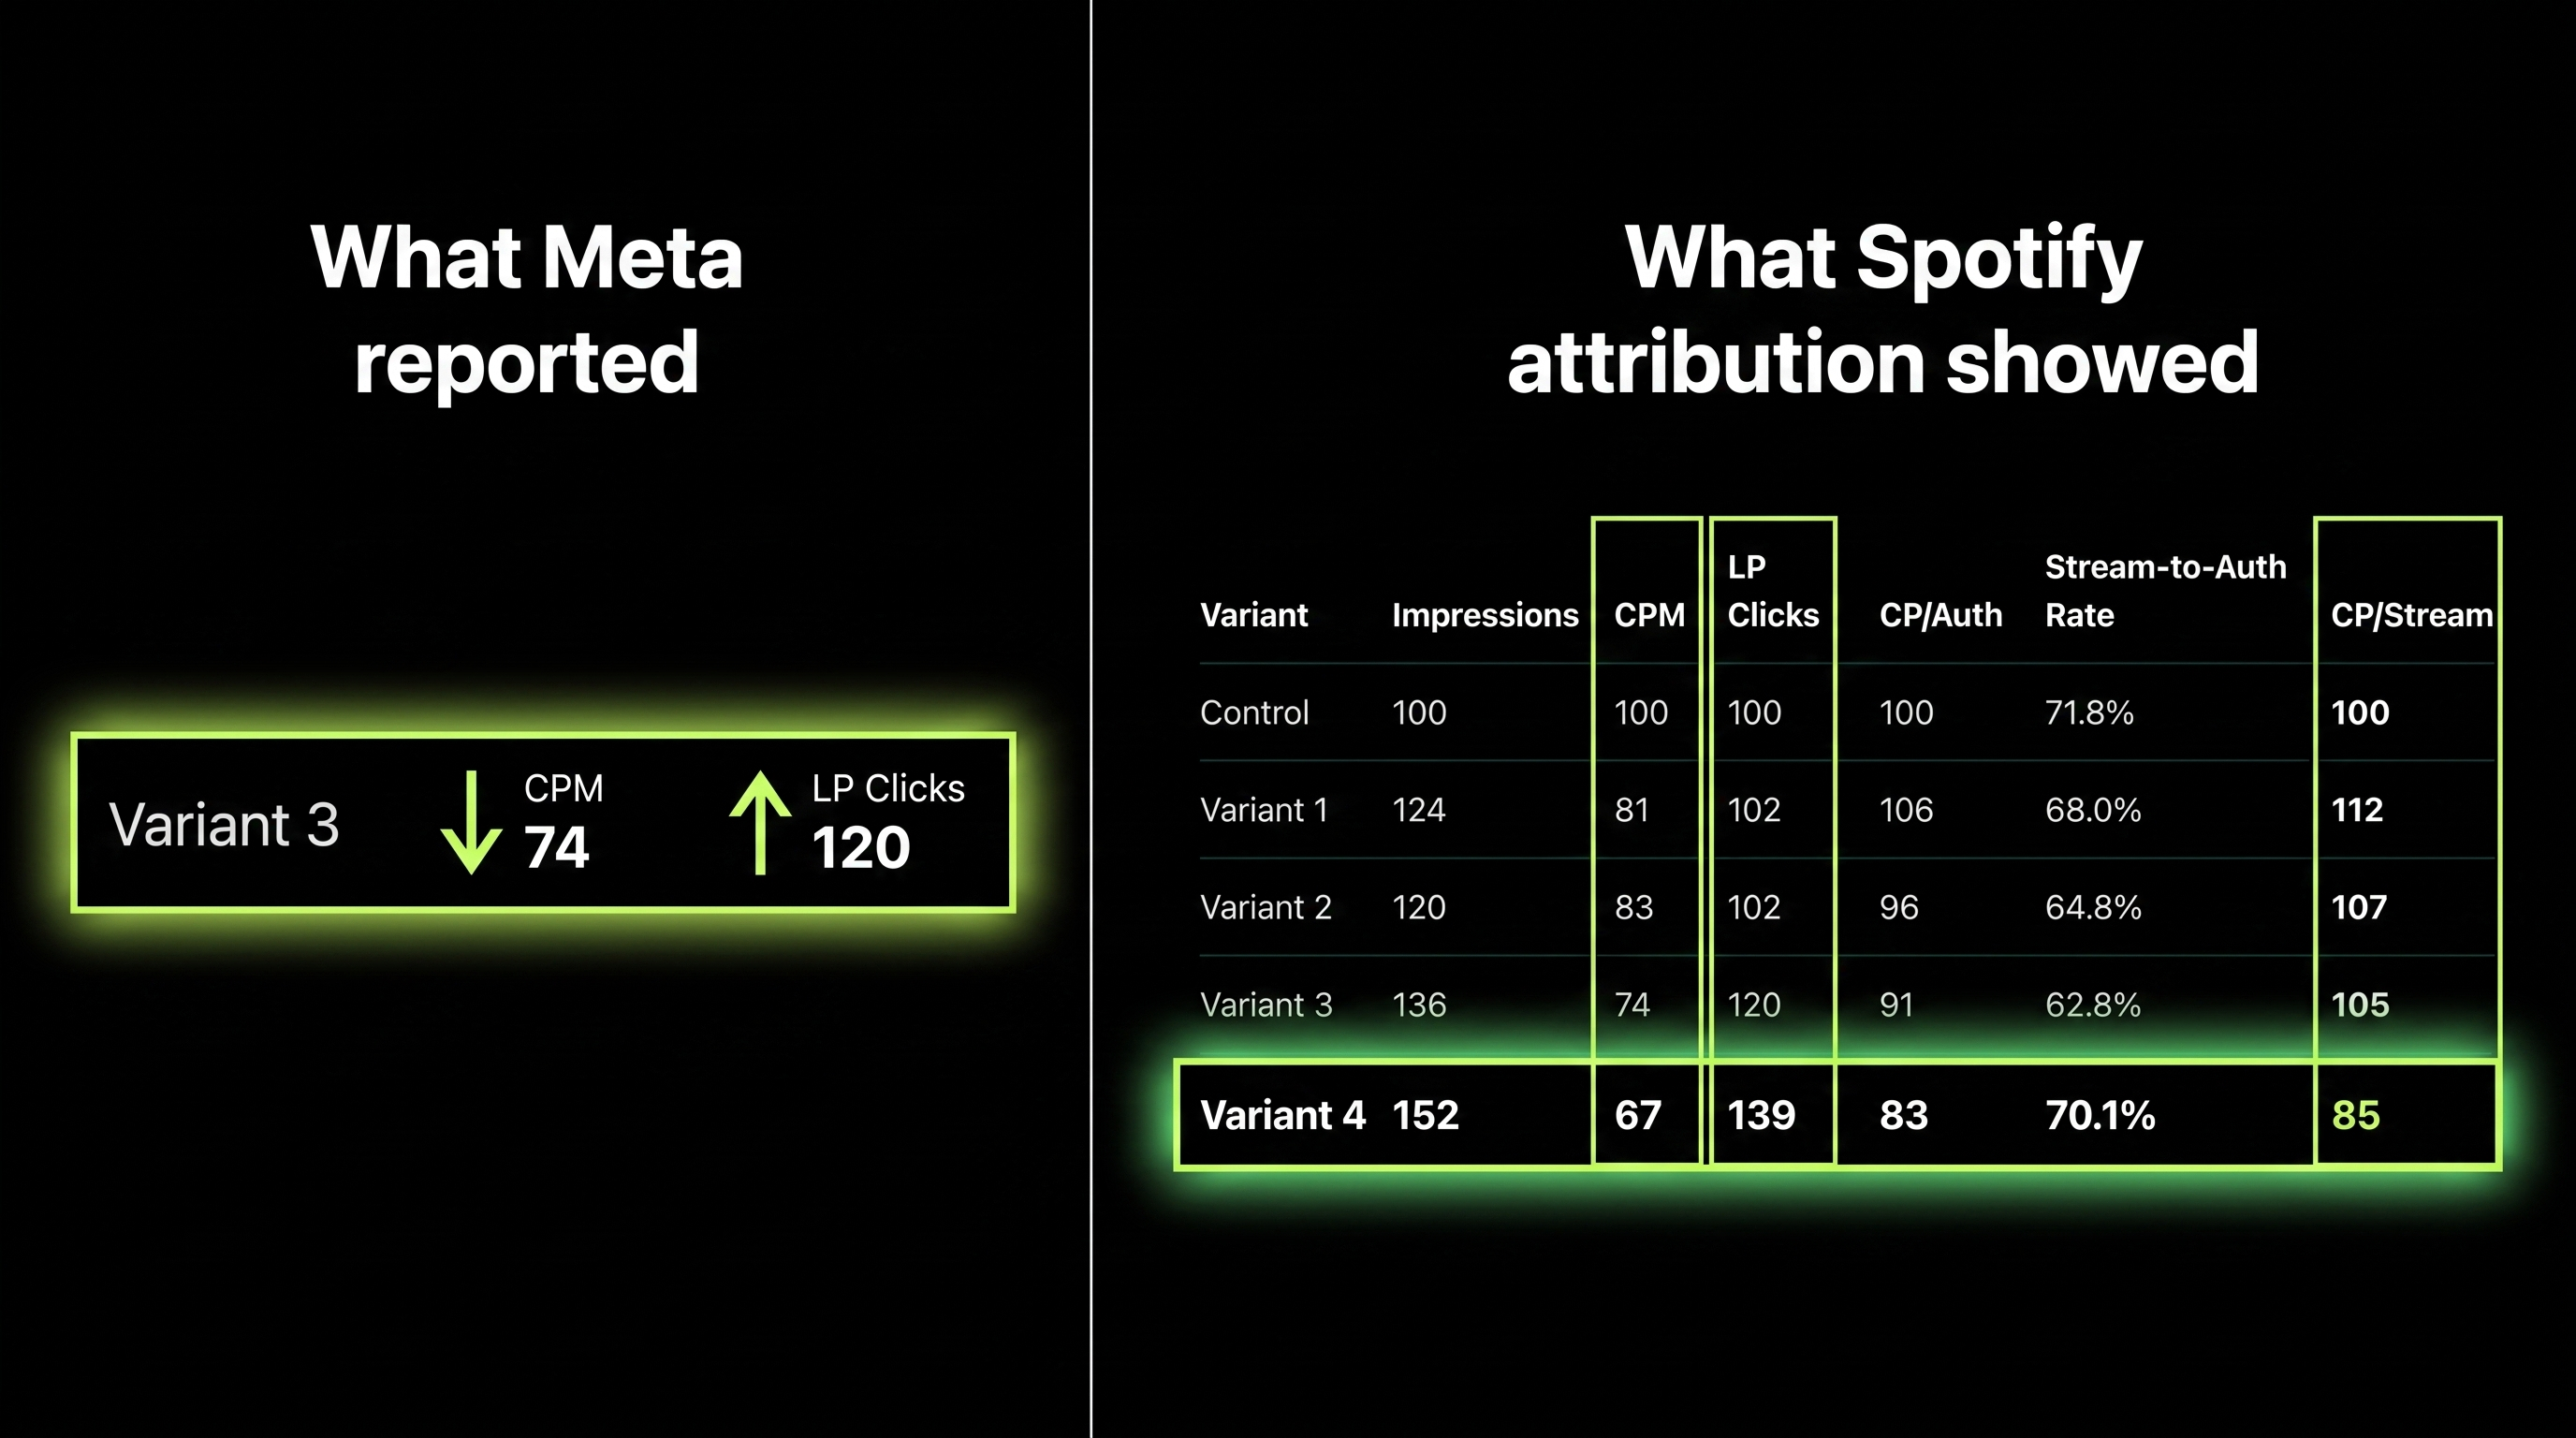
| Variant | Impressions | CPM | LP Clicks | CP/Auth | Stream-to-Auth Rate | CP/Stream |
|---|---|---|---|---|---|---|
| Control | 100 | 100 | 100 | 100 | 71.8% | 100 |
| Variant 1 | 124 | 81 | 102 | 106 | 68.0% | 112 |
| Variant 2 | 120 | 83 | 102 | 96 | 64.8% | 107 |
| Variant 3 | 136 | 74 | 120 | 91 | 62.8% | 105 |
| Variant 4 | 152 | 67 | 139 | 83 | 70.1% | 85 |
All figures indexed to Control = 100, except stream-to-auth rate which is shown as a percentage. Variant 4 spend was ~$81 vs ~$79 for Control through Variant 3.
Two Halves of the Funnel, Two Different Winners
The most important finding from Control through Variant 3 is that top-of-funnel efficiency and bottom-of-funnel quality are pulled in opposite directions.
Variant 3 won the top of the funnel. It produced the lowest CPM of the first four variants, the most landing page clicks (120 vs Control index 100), and the lowest cost per auth (index 91 vs Control 100). The change that drove this opened up cheaper inventory and broader reach.
Control won the bottom of the funnel. It produced the highest auth-to-stream rate (71.8%) and the lowest cost per stream of the first four variants. The production default variant had a quality mechanism built in that the others didn’t match.
If we’d optimised purely for top-of-funnel efficiency, we’d have scaled Variant 3. If we’d stayed with Control, we’d have kept quality but paid more for it. Neither decision would have been wrong on its own terms. Both would have missed what the data was pointing at.
The cheaper reach Variant 3 unlocked wasn’t producing lower-quality audiences. It was producing audiences that converted to streams at a lower rate because the variant that opened up the reach wasn’t paired with the mechanism that selects for stream intent. Separating those two things made it possible to combine them deliberately.
Variant 4: Combining Both Mechanisms
Variant 4 was designed specifically to test whether combining the top-of-funnel advantage from Variant 3 with the quality mechanism from Control would outperform both parents on cost per stream.
It did.
| Variant | CP/Auth (vs Control) | Stream-to-Auth Rate | CP/Stream (vs Control) |
|---|---|---|---|
| Variant 3 (top-of-funnel winner) | −9% | 62.8% | +5% |
| Control (bottom-of-funnel winner) | — | 71.8% | — |
| Variant 4 (combined) | −17% | 70.1% | −15% |
Variant 4 reached a 17% lower cost per auth than Control, maintained a 70.1% stream-to-auth rate (essentially matching Control’s 71.8%), and delivered 15% lower cost per stream overall, while generating 52% more impressions at a 33% lower CPM.
Meta’s reporting would have called this the winner based on impressions and cost alone. Spotify-side attribution confirmed it for a different reason: the combination held stream quality while opening up cheaper reach, not by sacrificing one for the other.
The Day-Over-Day Learning Effect
Variant 4’s Day 1 (June 16) showed the expected learning period drag: stream-to-auth rate of 48% and a cost per stream above Control. Days 2 through 5 consistently beat Control’s 5-day aggregate of $1.07 per stream.
| Day | CP/Stream (indexed to Control avg) | Stream-to-Auth Rate |
|---|---|---|
| Day 1 | 121 | 48.1% |
| Day 2 | 78 | 63.3% |
| Day 3 | 71 | 81.5% |
| Day 4 | 92 | 71.4% |
| Day 5 | 80 | 100.0% |
This matters for interpreting test results: all five variants in this test include their Day 1, making the comparison fully symmetric. Variant 4’s 15% cost-per-stream advantage over Control holds with learning-phase data included for both, not just during steady state.
A variant that looks weak in its first 24 hours often looks different by day 3. Calling tests early based on Day 1 or Day 2 data is one of the more common ways a targeting decision gets made on the wrong signal.
What This Shapes in How We Test
This test was structured around one principle: isolate one variable at a time, measure all the way to the stream, and don’t call a winner until you’ve seen the full funnel.
| Principle | What it prevents |
|---|---|
| Change one variable per variant | Avoids conflating two changes into one result you can’t explain |
| Measure to attributed streams, not just Meta conversions | Catches variants that win on Meta’s metrics but lose on stream quality |
| Run full periods including Day 1 | Ensures learning-phase drag is symmetric across variants |
| Combine winning mechanisms before scaling | Avoids locking in a partial win when the data points at a better combination |
Variant 4 is now being rolled out as a 50/50 A/B test against the current production Control across this campaign template. This mirrors the testing methodology we apply to playlist campaigns. A winner from a controlled test becomes a candidate, not a default, until it holds up in a broader rollout.
Why This Requires Spotify-Side Measurement
None of the decisions above would have been possible with Meta’s reporting alone.
Variant 3 would have been the obvious winner based on CPM, landing page clicks, and cost per auth. It produced the best numbers on every metric Meta can see. It was not the best variant on cost per stream, and it wasn’t the winner in the final combined test either.
The 15% cost-per-stream improvement from Variant 4 over Control was only visible because we measured what happened after the click, not just the click itself. Meta has no visibility past the landing page. The stream-to-auth rate, the day-over-day quality trend, and the combined variant’s performance against stream outcomes all required Spotify-side attribution to surface.
Soundlink’s paid campaigns report cost per listener, cost per follower, and cost per save alongside standard Meta metrics for every campaign, so the data needed to run a test like this — and act on it — is available without a separate analytics setup.
FAQ
Why did the variant that looked best on Meta’s metrics not win on cost per stream?
Meta’s reporting ends at the landing page or the on-platform conversion event. It can tell you how many people clicked through and how much that cost. It can’t tell you how many of those people actually played the track. A variant that generates cheaper clicks from a broader audience pool can produce the same number, or fewer, streams if that audience converts at a lower rate downstream.
What does “stream-to-auth rate” mean?
It’s the share of users who authenticated through the smart link (confirming they have a Spotify account and intend to stream) who then produced at least one attributed stream. A high stream-to-auth rate means the audience reaching Spotify is actually listening. A low one means clicks and auths are happening, but streaming isn’t following at the same rate.
Why do you change only one variable per variant?
Changing one variable at a time means you know what caused the result. If two variables change simultaneously and performance improves, you can’t tell which one drove the improvement, or whether they’re working together or one is working despite the other. Progressive isolation is slower but produces findings you can actually act on.
How does the Day 1 learning effect work?
When a new ad set launches, Meta’s algorithm doesn’t yet know which users within the target audience are most likely to convert. It spends the first day or two in a learning phase, testing the audience. During this period, delivery quality is typically lower and cost per outcome is higher. By Day 2 or 3, the algorithm has enough signal to improve. Comparing variants that include their respective Day 1 data keeps the comparison symmetric.
How does Soundlink measure cost per stream from a Meta campaign?
By connecting ad spend and audience data from Meta to actual listening activity on Spotify, then calculating cost per attributed stream, cost per listener, and cost per follower by ad set and audience segment. Soundlink’s paid campaigns surface these metrics automatically on every campaign, alongside standard Meta and TikTok reporting, so this type of analysis doesn’t require a separate data pipeline to run.