

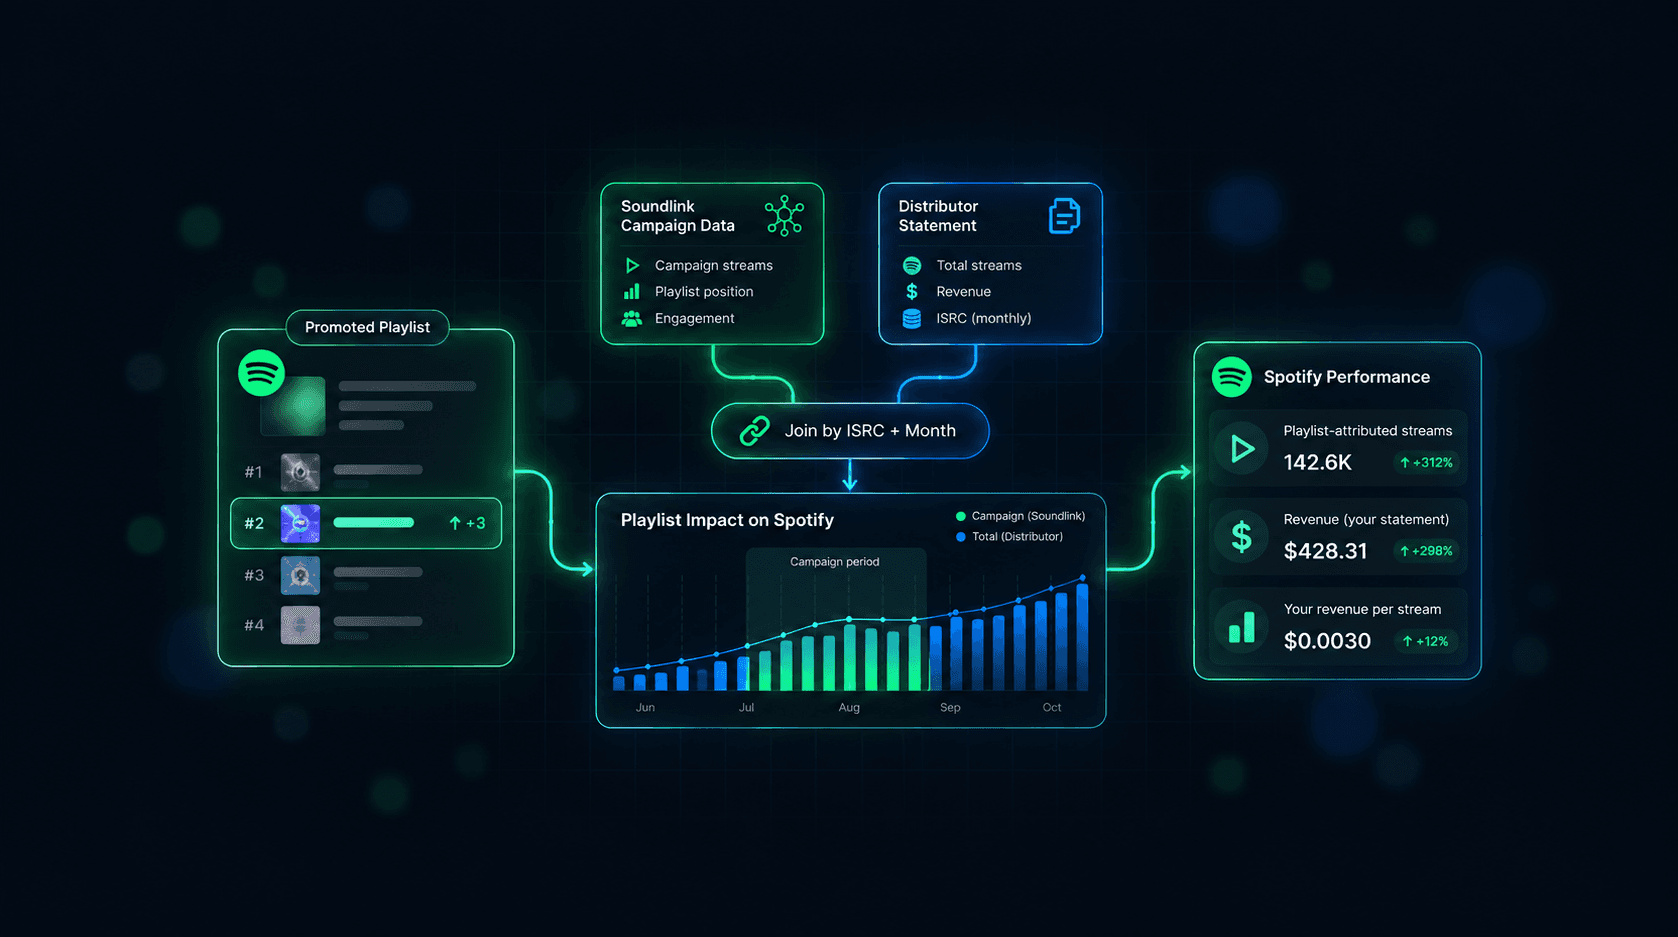

Say your distributor statement shows a track at 6,400 streams in August. It does not say how many came from the playlist you paid to promote. This guide joins Soundlink playlist engagement with that statement, by ISRC and month, so you can see what the campaign moved, where on the playlist it moved, and roughly what that was worth.
TL;DR
Load Soundlink data with the warehouse connector, load your distributor statement next to it, and join on ISRC by month. Soundlink gives you campaign streams and playlist position; the statement gives you total streams and revenue. Use Soundlink for the campaign window, the statement for before and after, and your own statement’s revenue per stream instead of an industry average.
This is part 2 of a series. Part 1 covers API keys and syncing metrics into a warehouse.
Your distributor knows the total, not the cause
A label runs a playlist campaign. Most of the playlist is its own catalog, with a few outside tracks to keep it listenable. The campaign ends and the question comes from finance, not marketing: did it pay for itself?
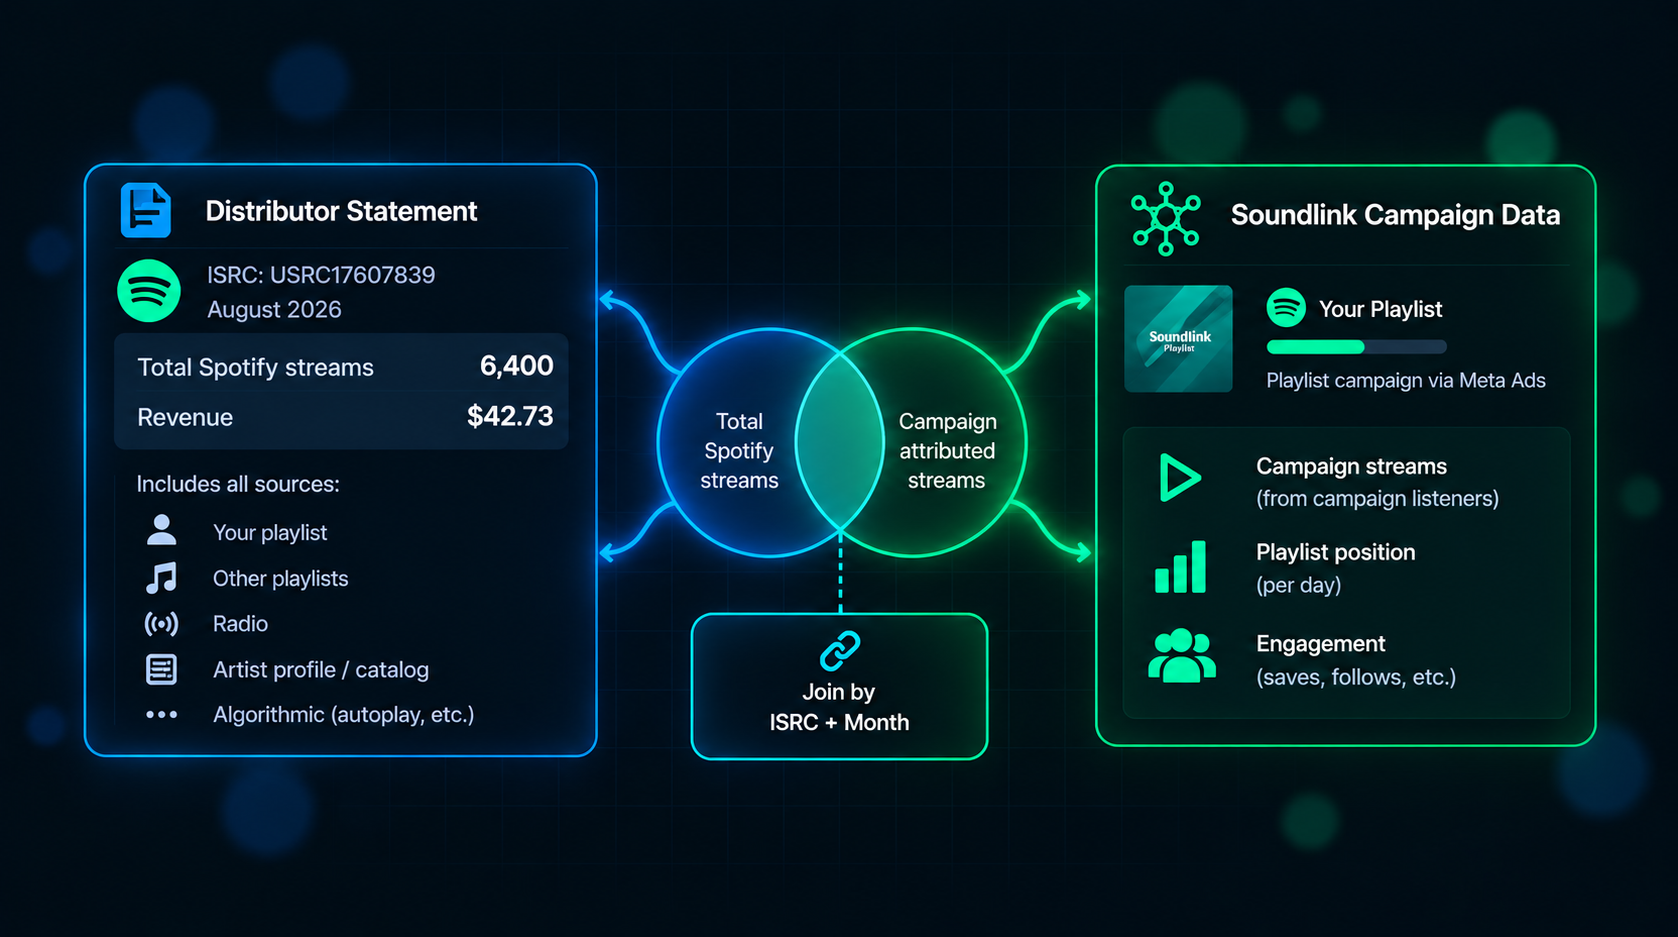
The statement counts every stream of an ISRC, from every source. Soundlink counts only listeners who came through the campaign link. The answer sits in the join, and the join is easy to get wrong.
Why playlists need different math than tracks
A track campaign promotes one song, and the interesting part is spillover into the artist’s catalog. A playlist campaign promotes dozens of songs at once, and that changes the analysis.
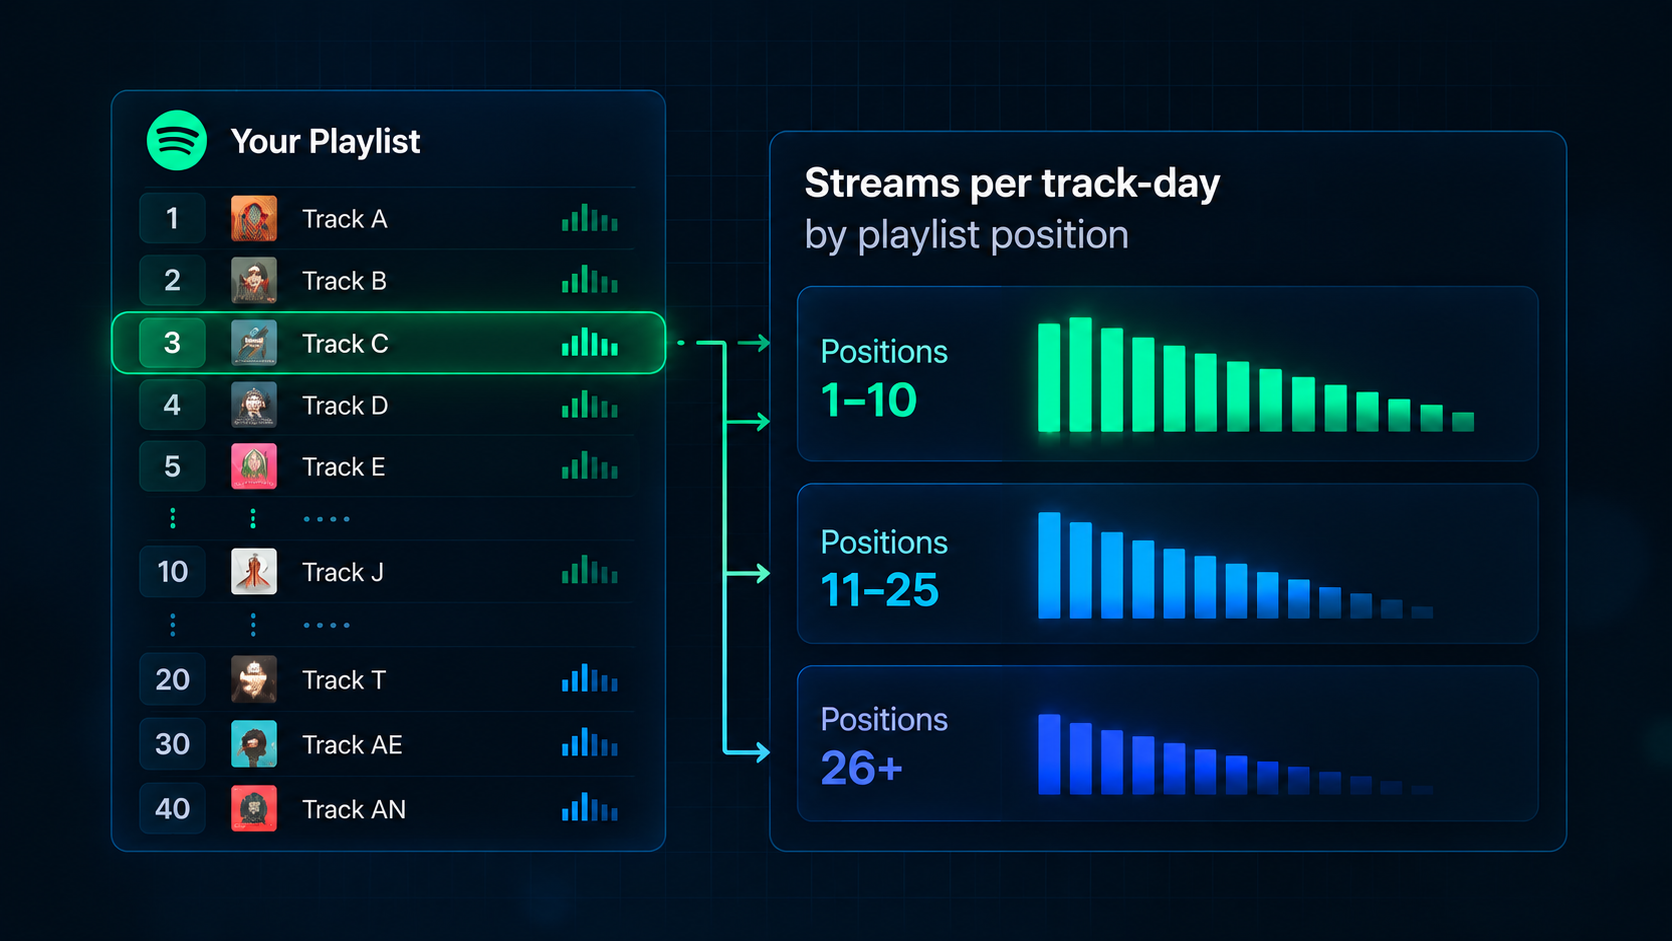
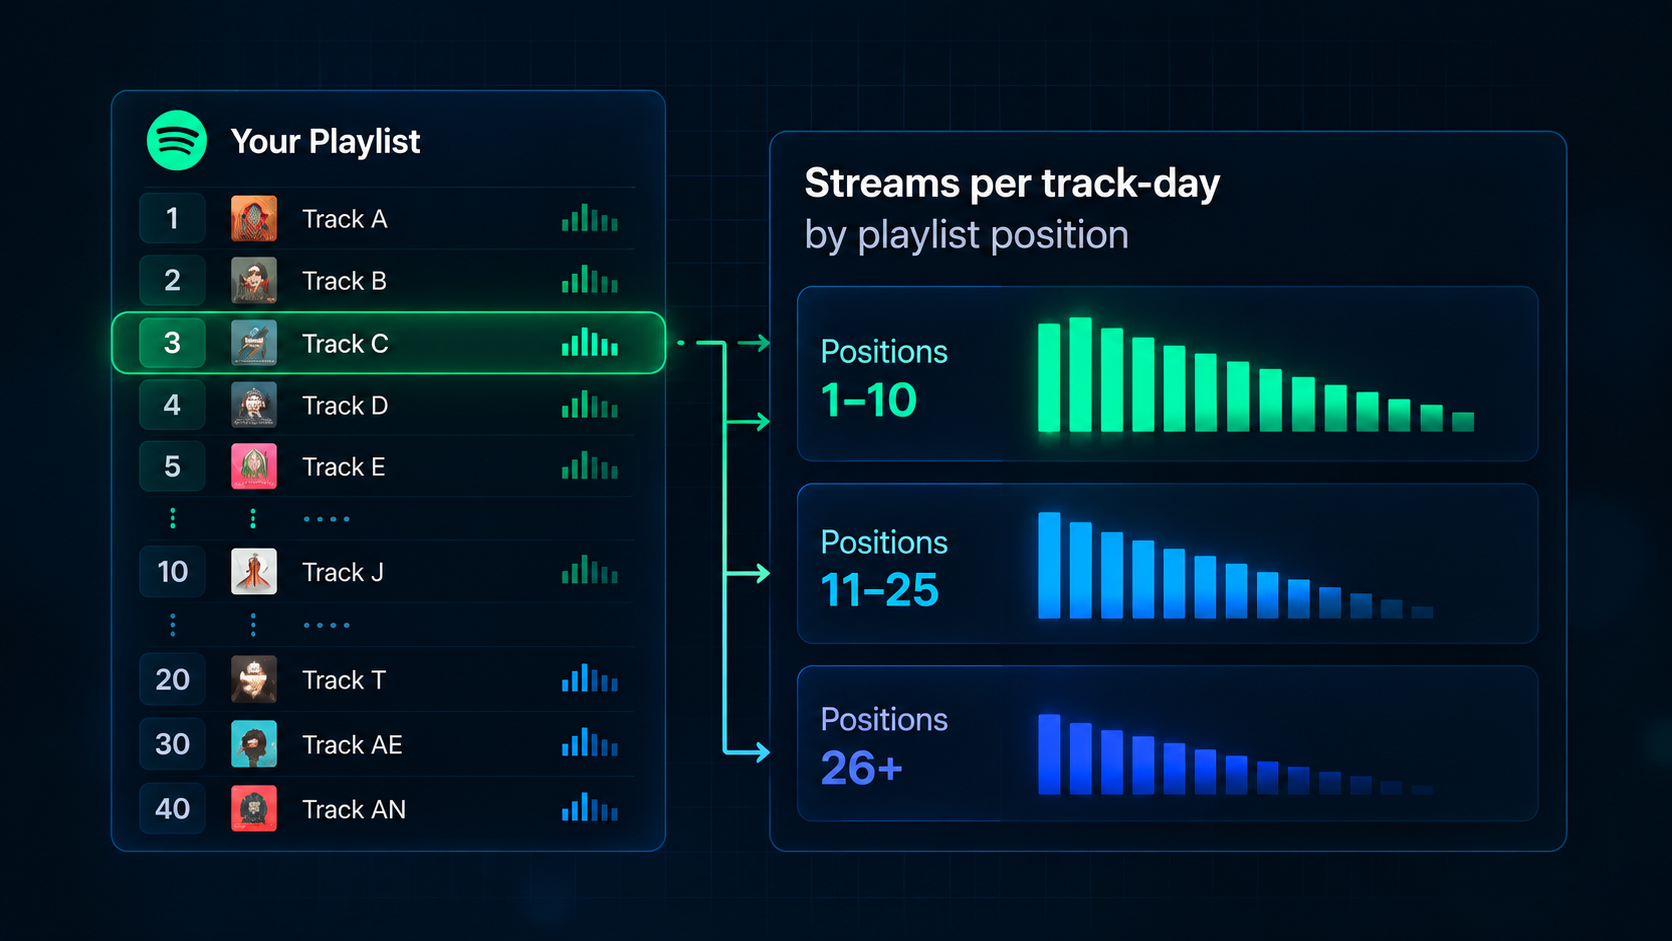
Position matters: slot 3 and slot 40 do not get the same attention, so Soundlink records each track’s position on the campaign playlist per day. Ownership matters too. Outside tracks on your playlist earn royalties for someone else, and so do tracks Spotify plays from the playlist context that are not on the playlist. None of them are on your statement, so the join drops them without extra work. Sum playlist engagement without the join and you count all of them.
Three numbers per ISRC
Everything below reduces to three numbers per track per month:
| Number | Source | Field |
|---|---|---|
| Streams from campaign listeners | Soundlink engagement export | streams where engagement_context = 'playlist' |
| Total Spotify streams and revenue | Your distributor statement | whatever your statement calls them, Spotify rows only |
| Playlist slot | Soundlink engagement export | playlist_position |
“Streams from campaign listeners” means plays from listeners who connected Spotify through the campaign’s soundlink, counted from the moment they connected, and only when Spotify reports the play as coming from the campaign playlist. A listener who saved the track and plays it from Liked Songs or the album is not counted, and neither is anyone who listened without connecting.
So treat it as mostly a floor.
Rules before you join
| Rule | Why |
|---|---|
| Compare Spotify with Spotify | Soundlink only sees Spotify. Your statement sums every store, so filter it to Spotify rows before any comparison. |
| Writing your own SQL? | Join on ISRC, never track name. Aggregate Soundlink to month before joining, or daily rows duplicate monthly totals. Sum streams, never listeners across days. |
| Use the sale month, not the statement month | If yours carries both, pick the sale month. The statement month lags the listening, which shifts every before/during/after comparison. |
| Use Soundlink for the campaign window only | Soundlink data after a campaign ends is partial, so a drop there is not listeners leaving. The queries keep only days with spend; use the statement for “after.” |
| Leave the last 7 days out of conclusions | Rows can still change for 7 days after a date closes. See Campaign metrics. |
| Wait for the statement to catch up | Statements arrive after the fact. Before reading “after,” make sure yours covers at least one full month past the campaign. |
The workflow
1. Get Soundlink data into DuckDB
Follow Part 1 to create a key with campaigns:read and metrics:read.
Then run the warehouse connector:
uv run soundlink-sync sync --mode full
uv run soundlink-sync sync --mode incremental
Run full once, then incremental on a schedule; it re-pulls the last 10 days, so rows that change after the fact get corrected. Data lands in ./data/soundlink.duckdb, with campaign_engagement_daily holding the playlist rows and campaign_country_daily holding spend.
To test one campaign first, add --campaign-id <uuid>.
2. Load your distributor statement
Distributor exports vary. Map yours to seven columns and save it as CSV: isrc, store, sale_month (YYYY-MM), country_code, streams, revenue, currency. Rename your statement’s Spotify rows so store reads exactly Spotify. If your export is daily, truncate to month first.
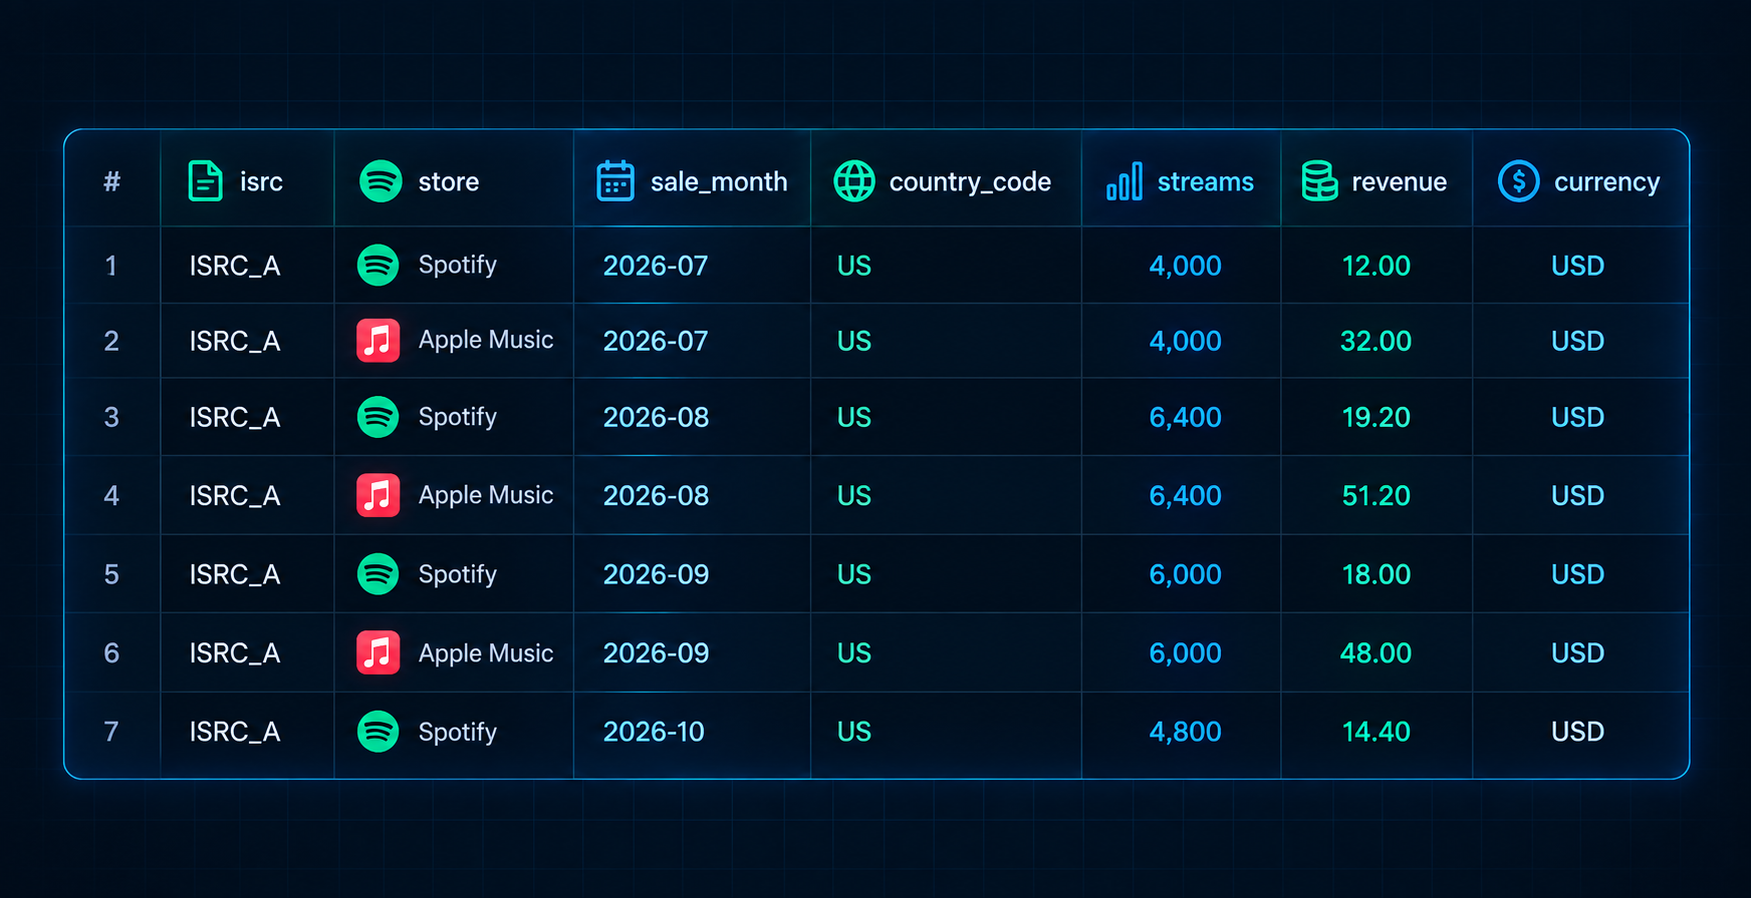
You can start from this sample distributor CSV — same columns the query below expects.
Then, in the same DuckDB file:
CREATE OR REPLACE TABLE distributor_monthly AS
SELECT
  isrc,
  CAST(sale_month || '-01' AS DATE) AS month,
  country_code,
  streams,
  revenue,
  currency
FROM read_csv_auto('distributor_statements.csv')
WHERE store = 'Spotify';
3. What share of each track’s streams came through the campaign
WITH campaign_days AS (
  SELECT MIN(report_date) AS first_day, MAX(report_date) AS last_day
  FROM campaign_country_daily
  WHERE campaign_id = 'YOUR_CAMPAIGN_ID'
    AND spend_total > 0
),
soundlink AS (
  SELECT
    e.engaged_track_isrc AS isrc,
    date_trunc('month', e.report_date) AS month,
    SUM(e.streams) AS soundlink_streams
  FROM campaign_engagement_daily e
  CROSS JOIN campaign_days w
  WHERE e.campaign_id = 'YOUR_CAMPAIGN_ID'
    AND e.engagement_context = 'playlist'
    AND e.report_date BETWEEN w.first_day AND w.last_day
  GROUP BY ALL
),
distributor AS (
  SELECT isrc, month, SUM(streams) AS distributor_streams
  FROM distributor_monthly
  GROUP BY ALL
)
SELECT
  d.isrc,
  d.month,
  COALESCE(s.soundlink_streams, 0) AS soundlink_streams,
  d.distributor_streams,
  ROUND(COALESCE(s.soundlink_streams, 0) / NULLIF(d.distributor_streams, 0), 3) AS attributed_share
FROM distributor d
LEFT JOIN soundlink s USING (isrc, month)
WHERE d.isrc IN (SELECT isrc FROM soundlink)
ORDER BY d.isrc, d.month;
Months before and after the campaign show as zeros instead of missing rows.
It will not reconcile to the stream: Soundlink reads connected listeners’ activity, and your statement comes from a different count. Read the share as a signal. 14% one month and 3% the next means something; 13.8% versus 14.1% does not.
4. Does position change the outcome
Position is a daily value, so this one stays at day grain, limited to campaign days so partial post-campaign days do not drag the averages down:
WITH campaign_days AS (
  SELECT MIN(report_date) AS first_day, MAX(report_date) AS last_day
  FROM campaign_country_daily
  WHERE campaign_id = 'YOUR_CAMPAIGN_ID'
    AND spend_total > 0
),
track_days AS (
  SELECT
    e.report_date,
    e.engaged_track_isrc AS isrc,
    MIN(e.playlist_position) AS playlist_position,
    SUM(e.streams) AS streams
  FROM campaign_engagement_daily e
  CROSS JOIN campaign_days w
  WHERE e.campaign_id = 'YOUR_CAMPAIGN_ID'
    AND e.engagement_context = 'playlist'
    AND e.playlist_position IS NOT NULL
    AND e.report_date BETWEEN w.first_day AND w.last_day
  GROUP BY ALL
)
SELECT
  CASE
    WHEN playlist_position <= 10 THEN '01-10'
    WHEN playlist_position <= 25 THEN '11-25'
    ELSE '26+'
  END AS position_band,
  COUNT(*) AS track_days,
  SUM(streams) AS streams,
  ROUND(AVG(streams), 1) AS streams_per_track_day
FROM track_days
GROUP BY ALL
ORDER BY position_band;
Compare streams_per_track_day across bands; totals mostly reflect how many tracks sit in each band. If the top ten earn several times what slot 26 and below earn, that is a case for moving the catalog you most need to recoup up the list. It is not proof: curators also put their strongest tracks at the top, so position and streams can move together for reasons unrelated to slot.
5. Before, during, after
This one uses only the statement, restricted to your tracks that sat on the playlist. The campaign window comes from the days Soundlink recorded spend:
WITH spend_window AS (
  SELECT
    date_trunc('month', MIN(report_date)) AS first_month,
    date_trunc('month', MAX(report_date)) AS last_month
  FROM campaign_country_daily
  WHERE campaign_id = 'YOUR_CAMPAIGN_ID'
    AND spend_total > 0
),
own_tracks AS (
  SELECT DISTINCT engaged_track_isrc AS isrc
  FROM campaign_engagement_daily
  WHERE campaign_id = 'YOUR_CAMPAIGN_ID'
    AND engagement_context = 'playlist'
    AND playlist_position IS NOT NULL
)
SELECT
  CASE
    WHEN d.month < w.first_month THEN '1_before'
    WHEN d.month <= w.last_month THEN '2_during'
    ELSE '3_after'
  END AS period,
  COUNT(DISTINCT d.month) AS months,
  SUM(d.streams) AS distributor_streams,
  ROUND(SUM(d.streams) / COUNT(DISTINCT d.month)) AS streams_per_month
FROM distributor_monthly d
JOIN own_tracks USING (isrc)
CROSS JOIN spend_window w
GROUP BY ALL
ORDER BY period;
Compare streams_per_month, since the periods have different lengths. Month grain blurs the edges — a campaign that starts on the 10th makes its first month partly “before” — which only matters when the gap between periods is small.
6. A rough recoup number
An estimate, not an audit. It prices each Soundlink stream at your statement’s revenue per stream for that ISRC and month, then compares the total with campaign spend.
WITH campaign_days AS (
SELECT MIN(report_date) AS first_day, MAX(report_date) AS last_day
FROM campaign_country_daily
WHERE campaign_id = 'YOUR_CAMPAIGN_ID'
AND spend_total > 0
),
spend AS (
SELECT SUM(spend_total) AS spend_usd
FROM campaign_country_daily
WHERE campaign_id = 'YOUR_CAMPAIGN_ID'
),
soundlink AS (
SELECT
e.engaged_track_isrc AS isrc,
date_trunc('month', e.report_date) AS month,
SUM(e.streams) AS soundlink_streams
FROM campaign_engagement_daily e
CROSS JOIN campaign_days w
WHERE e.campaign_id = 'YOUR_CAMPAIGN_ID'
AND e.engagement_context = 'playlist'
AND e.report_date BETWEEN w.first_day AND w.last_day
GROUP BY ALL
),
rate AS (
SELECT isrc, month, SUM(revenue) / NULLIF(SUM(streams), 0) AS revenue_per_stream
FROM distributor_monthly
WHERE currency = 'USD'
GROUP BY ALL
)
SELECT
ROUND(SUM(s.soundlink_streams * r.revenue_per_stream), 2) AS attributed_revenue_estimate,
ANY_VALUE(spend.spend_usd) AS spend_usd,
ROUND(SUM(s.soundlink_streams * r.revenue_per_stream) / ANY_VALUE(spend.spend_usd), 3) AS recoup_ratio
FROM soundlink s
JOIN rate r USING (isrc, month)
CROSS JOIN spend;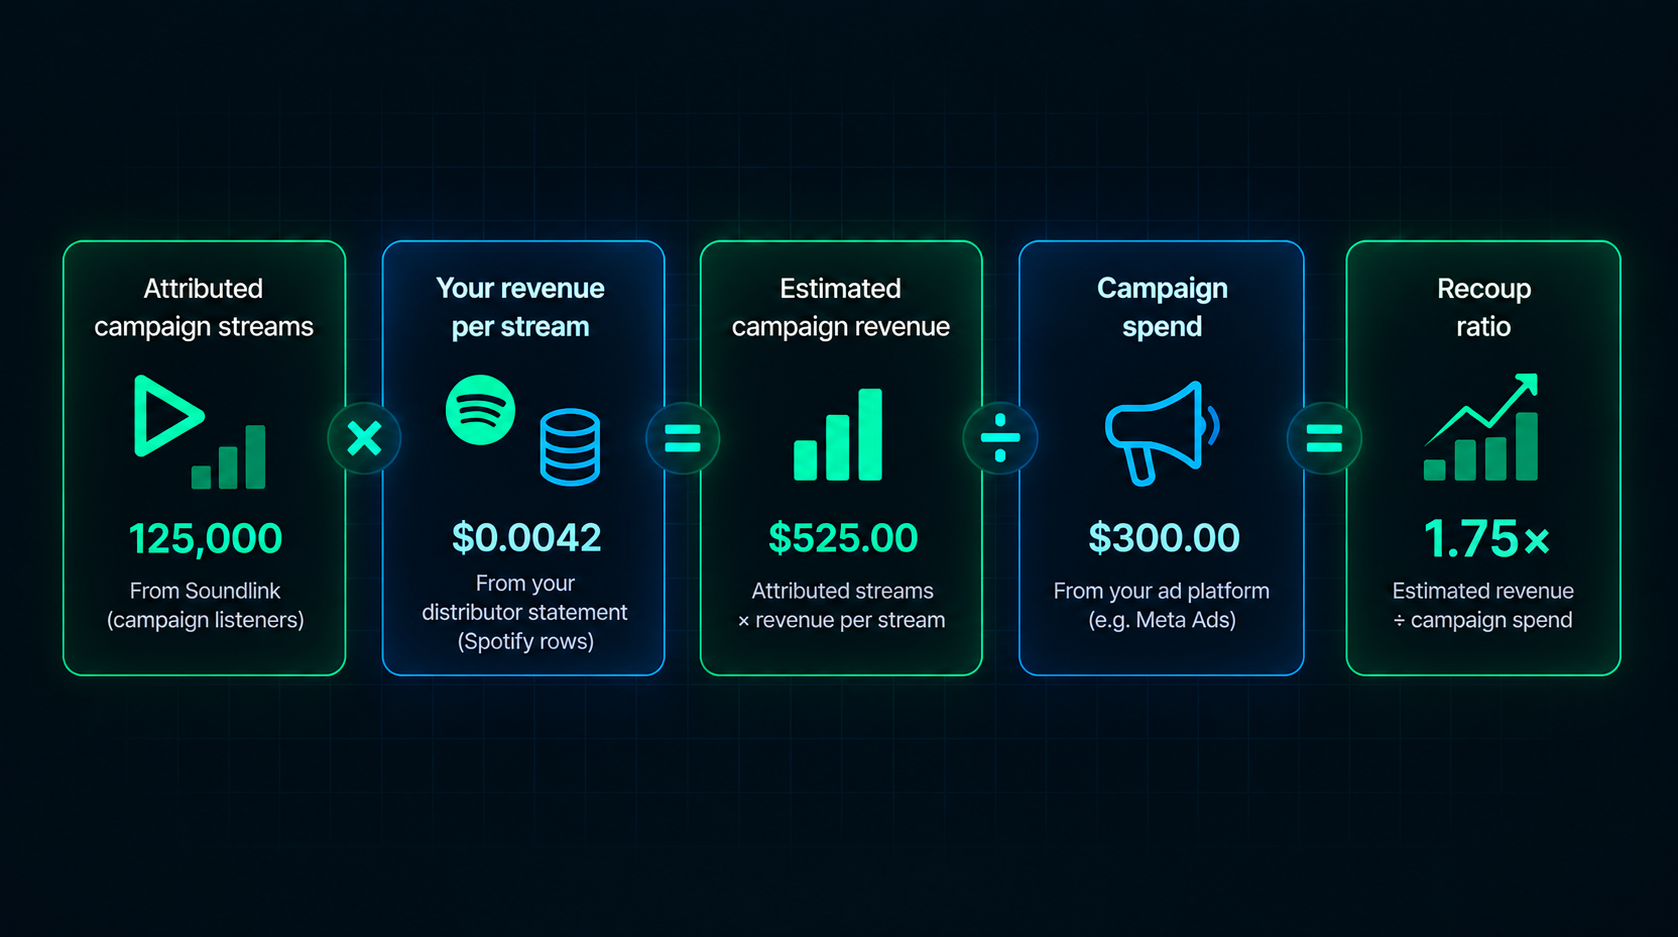 It leaves out plays from Liked Songs, albums and other contexts, listeners who never connected, streams after the campaign window, and what new listeners are worth once they stay — all of which make the real number higher.
Know what each side contains, too. spend_total is what Soundlink billed, fees included, which is the right number for “did it pay for itself.” Depending on your distributor, statement revenue may already be net of its commission, and for a label it is before the artist’s share. Tracks below Spotify’s royalty eligibility threshold earn no recording royalties, so deep-catalog tracks can show streams and zero revenue. The query assumes USD on both sides; check the breakdown’s currency column and convert statement rows if needed.
A ratio well under 1 is a reason to check the before/after query, not a verdict.
Mistakes that make the numbers lie
Reading correlation as attribution. A statement that rises in the campaign month proves nothing alone — seasonality, a release, or an editorial add can do the same. Attributed share plus before/after is much harder to fool.
Trusting a quiet position column. A null position can mean a track that was not on the playlist that day, or a day without position data. A campaign with no positions at all means no position data for that playlist, not that every track was off it. Check whether any row for that campaign and day has a position before reading a null. See Playlist position.
Other setups
For a shared warehouse, set DESTINATION=bigquery and the same tables land in BigQuery. The SQL here is DuckDB syntax, so adapt the CSV load and date functions.
No paid ads? --entity soundlinks syncs standalone soundlinks into soundlink_engagement_daily, with the same playlist_position column. It needs a key with soundlinks:read. There is no spend, so the position query works and the recoup query does not.
Checklist
- [ ] Key with
campaigns:read+metrics:read; connector synced full, then incremental on a schedule - [ ] Statement mapped to the seven columns, Spotify rows only, by sale month
- [ ] Statement covers at least a month past the campaign; last 7 days of Soundlink data left out
- [ ] Attributed share, position bands, and before/during/after
- [ ] Recoup labeled as an estimate, with what it leaves out written next to it
Frequently Asked Questions
Can I do this without Python?
Yes. Load the engagement and breakdown JSONL exports into whatever you use. Column names are in Campaign metrics.
Does this work for track campaigns?
The join works the same way on engagement_context = 'catalog', which covers the promoted track and same-artist spillover. Position does not apply.
If you already sync Soundlink into a warehouse, the smallest useful step is query 3 for one finished campaign and one statement. It tells you whether the rest is worth building.
Next in the series: rolling campaign spend up across your roster, so the recoup conversation happens per artist instead of per campaign.